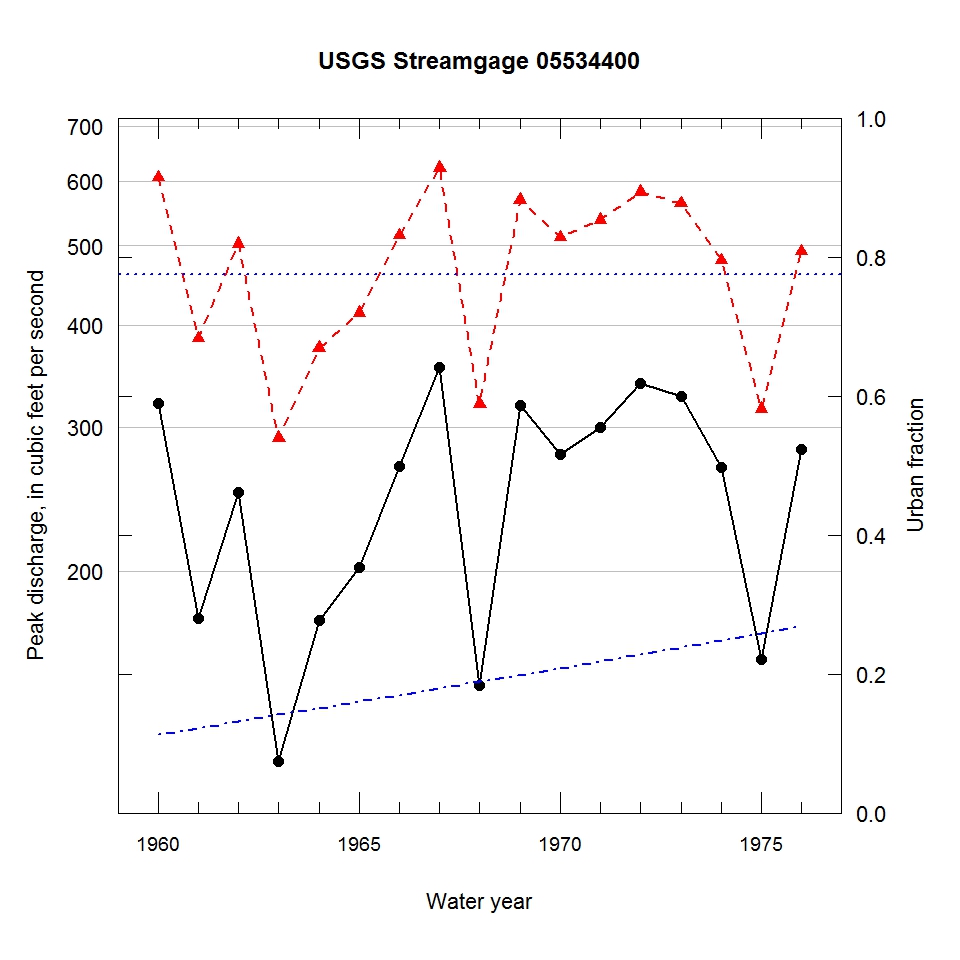
Observed and urbanization-adjusted annual maximum peak discharge and associated urban fraction and precipitation values at USGS streamgage:
05534400 NORTH BRANCH CHICAGO RIVER AT BANNOCKBURN, IL


| Water year | Segment | Discharge code | Cumulative reservoir storage (acre-feet) | Urban fraction | Precipitation (inches) | Observed peak discharge (ft3/s) | Adjusted peak discharge (ft3/s) | Exceedance probability |
| 1960 | 1 | -- | 0 | 0.113 | 0.467 | 321 | 606 | 0.243 |
| 1961 | 1 | -- | 0 | 0.122 | 1.199 | 175 | 385 | 0.663 |
| 1962 | 1 | -- | 0 | 0.132 | 0.220 | 250 | 503 | 0.421 |
| 1963 | 1 | -- | 0 | 0.141 | 1.368 | 117 | 291 | 0.850 |
| 1964 | 1 | -- | 0 | 0.151 | 0.810 | 174 | 375 | 0.687 |
| 1965 | 1 | -- | 0 | 0.160 | 0.538 | 202 | 414 | 0.605 |
| 1966 | 1 | -- | 0 | 0.170 | 0.546 | 269 | 515 | 0.397 |
| 1967 | 1 | -- | 0 | 0.179 | 1.372 | 355 | 623 | 0.221 |
| 1968 | 1 | 2 | 0 | 0.189 | 0.506 | 145 | 320 | 0.799 |
| 1969 | 1 | -- | 0 | 0.198 | 2.440 | 319 | 569 | 0.301 |
| 1970 | 1 | -- | 0 | 0.208 | 2.055 | 278 | 512 | 0.403 |
| 1971 | 1 | 2 | 0 | 0.218 | 0.329 | 300 | 538 | 0.357 |
| 1972 | 1 | -- | 0 | 0.228 | 3.167 | 339 | 582 | 0.280 |
| 1973 | 1 | -- | 0 | 0.238 | 1.420 | 327 | 563 | 0.311 |
| 1974 | 1 | -- | 0 | 0.248 | 1.223 | 268 | 480 | 0.465 |
| 1975 | 1 | -- | 0 | 0.259 | 0.409 | 156 | 316 | 0.807 |
| 1976 | 1 | -- | 0 | 0.269 | 1.912 | 282 | 492 | 0.443 |

